GraphNova
Interactive architecture maps your whole team can explore, review and share.
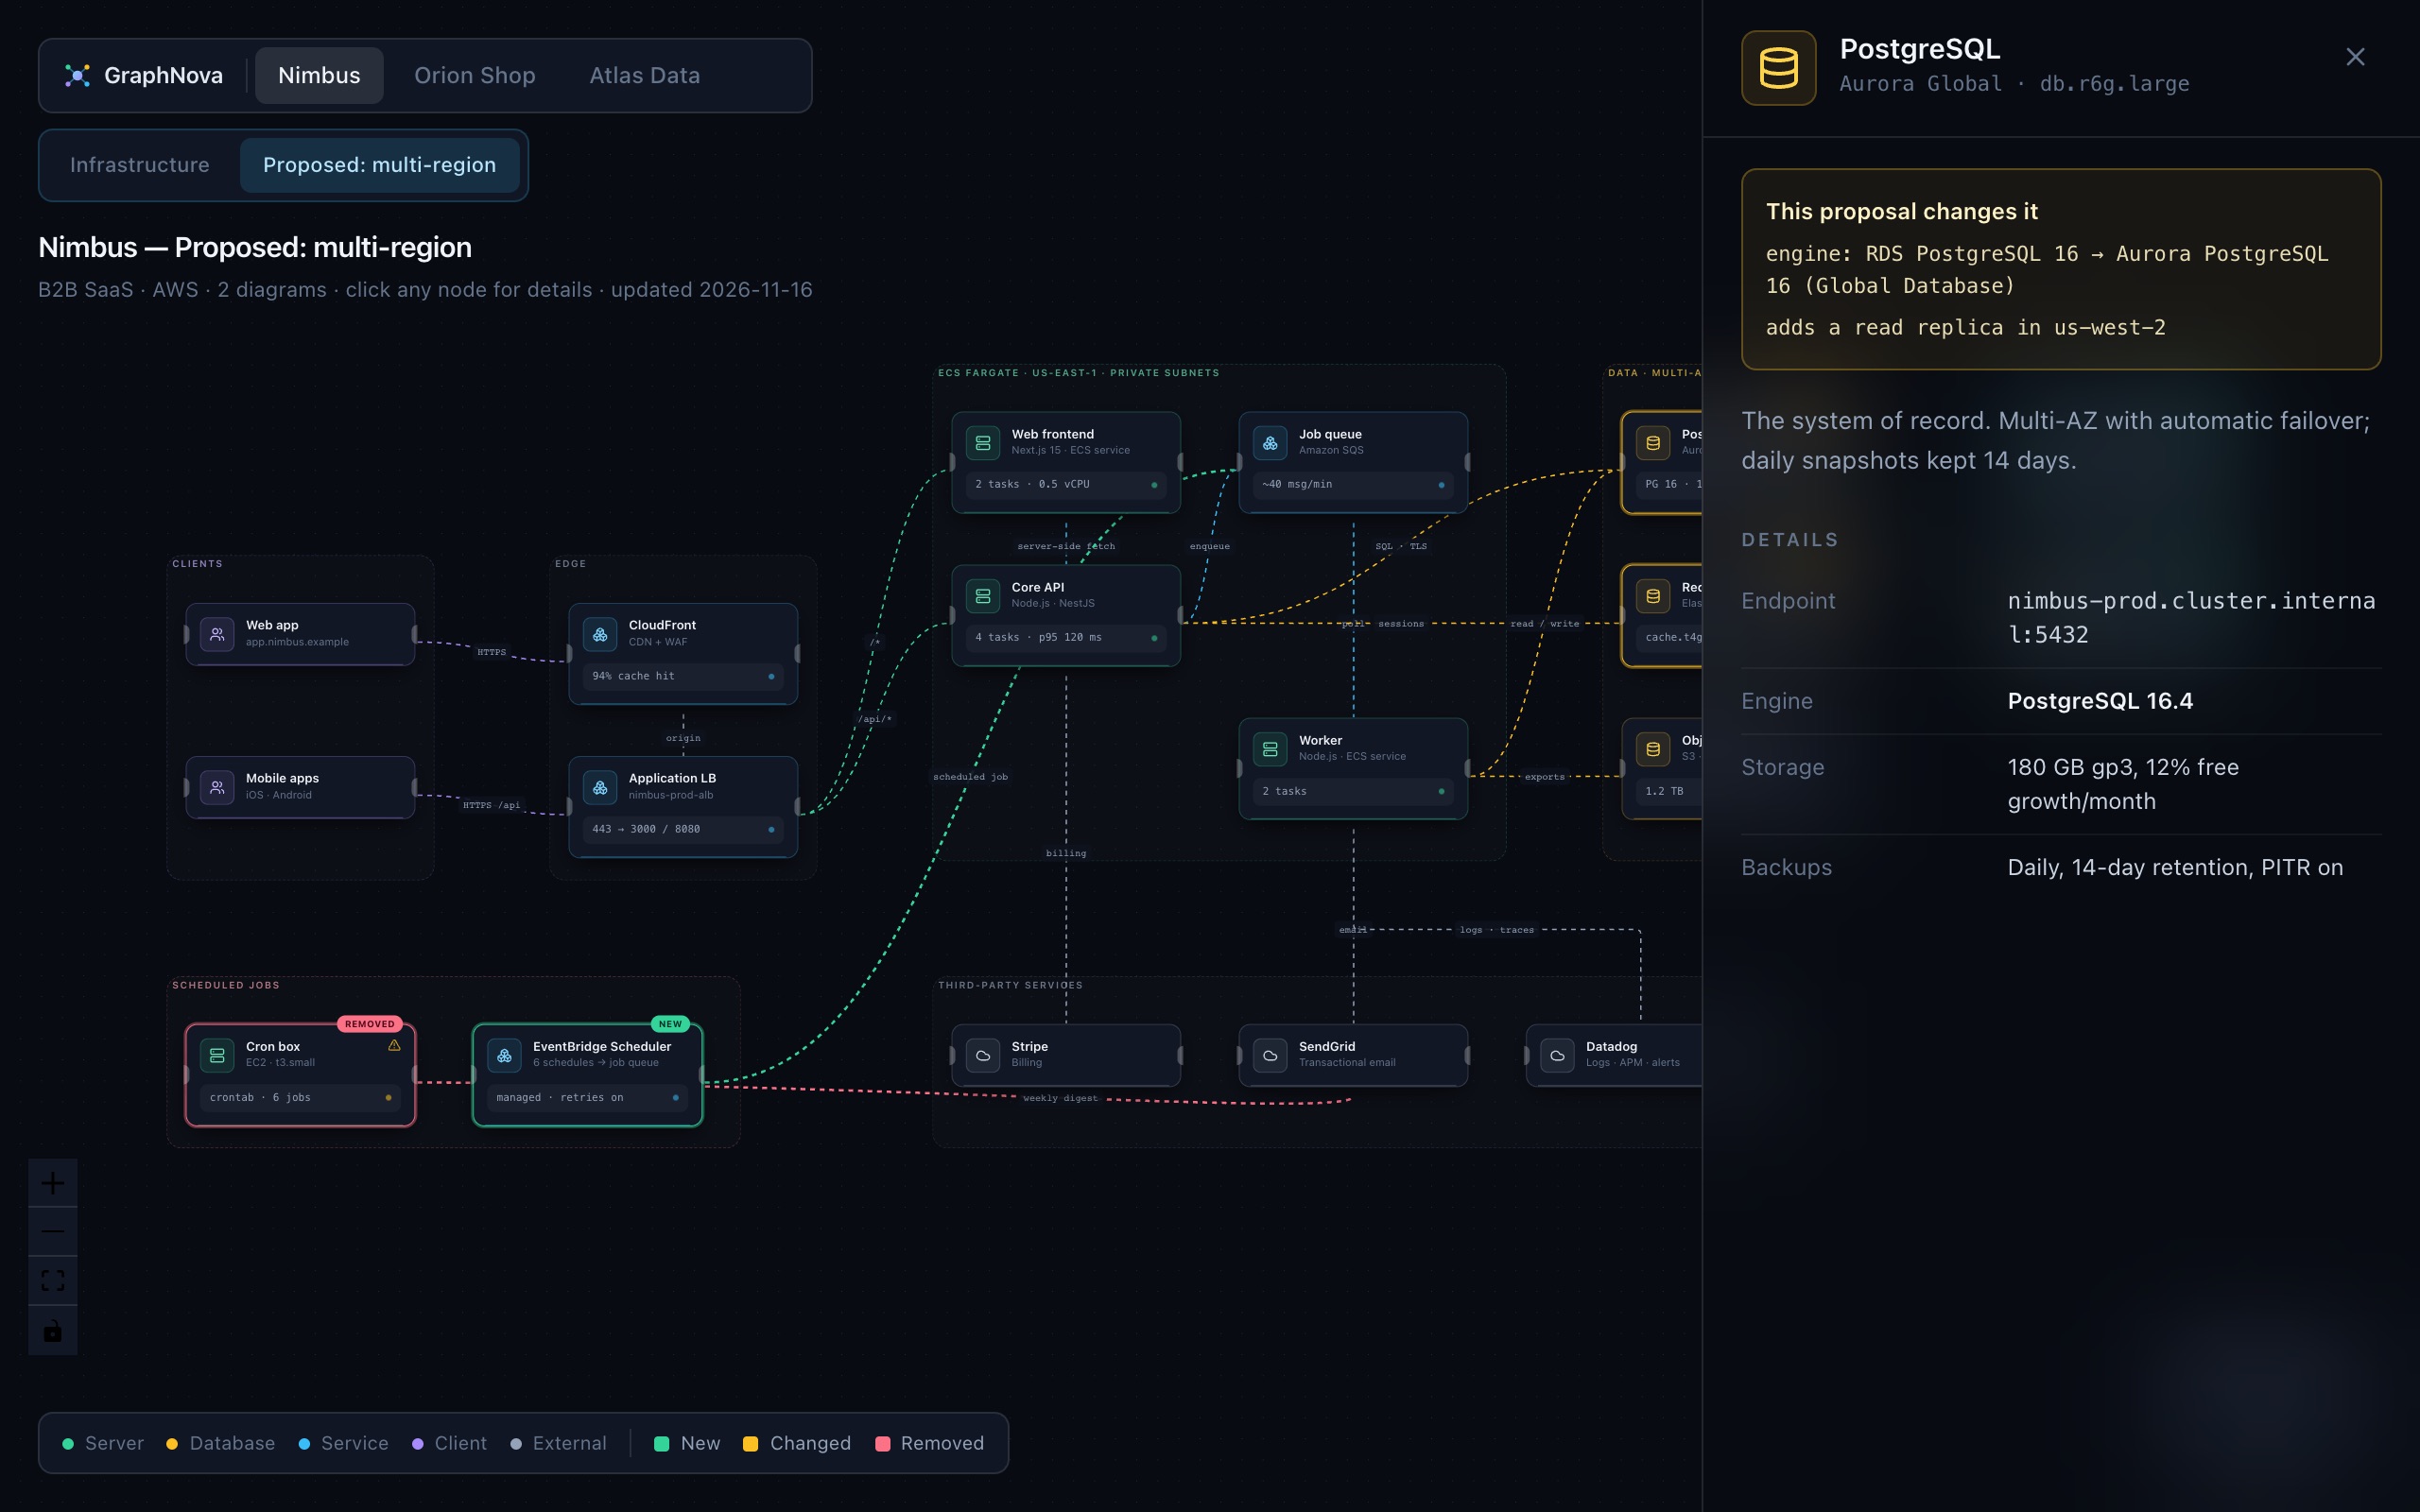
GraphNova turns your infrastructure and application architecture into a living, clickable map. Every server, database, service and integration is a box you can open to see its real details — specs, endpoints, owners and known risks — instead of a static picture that goes stale in a slide deck.
- 1 click
- from a box to its full details
- 3 in 1
- infrastructure, flows and proposals per project
- PNG · PDF
- one-click export
- 100%
- static — host it anywhere
What it is
Architecture knowledge usually lives in a few people's heads, a wiki page nobody updates and a diagram exported two years ago. GraphNova gives each system a map that is both a picture and a reference: the layout shows how everything connects, and clicking any box opens what you need to operate it — instance sizes, endpoints, versions, owners and the things worth a look.
Diagrams are plain data files kept in your repository, so they are versioned, reviewed and diffed like code. A project can hold several diagrams — infrastructure, request flows, authentication, a proposed migration — and a proposal view marks exactly what is new, changed or removed before anyone approves it.
What it can do
Click for details
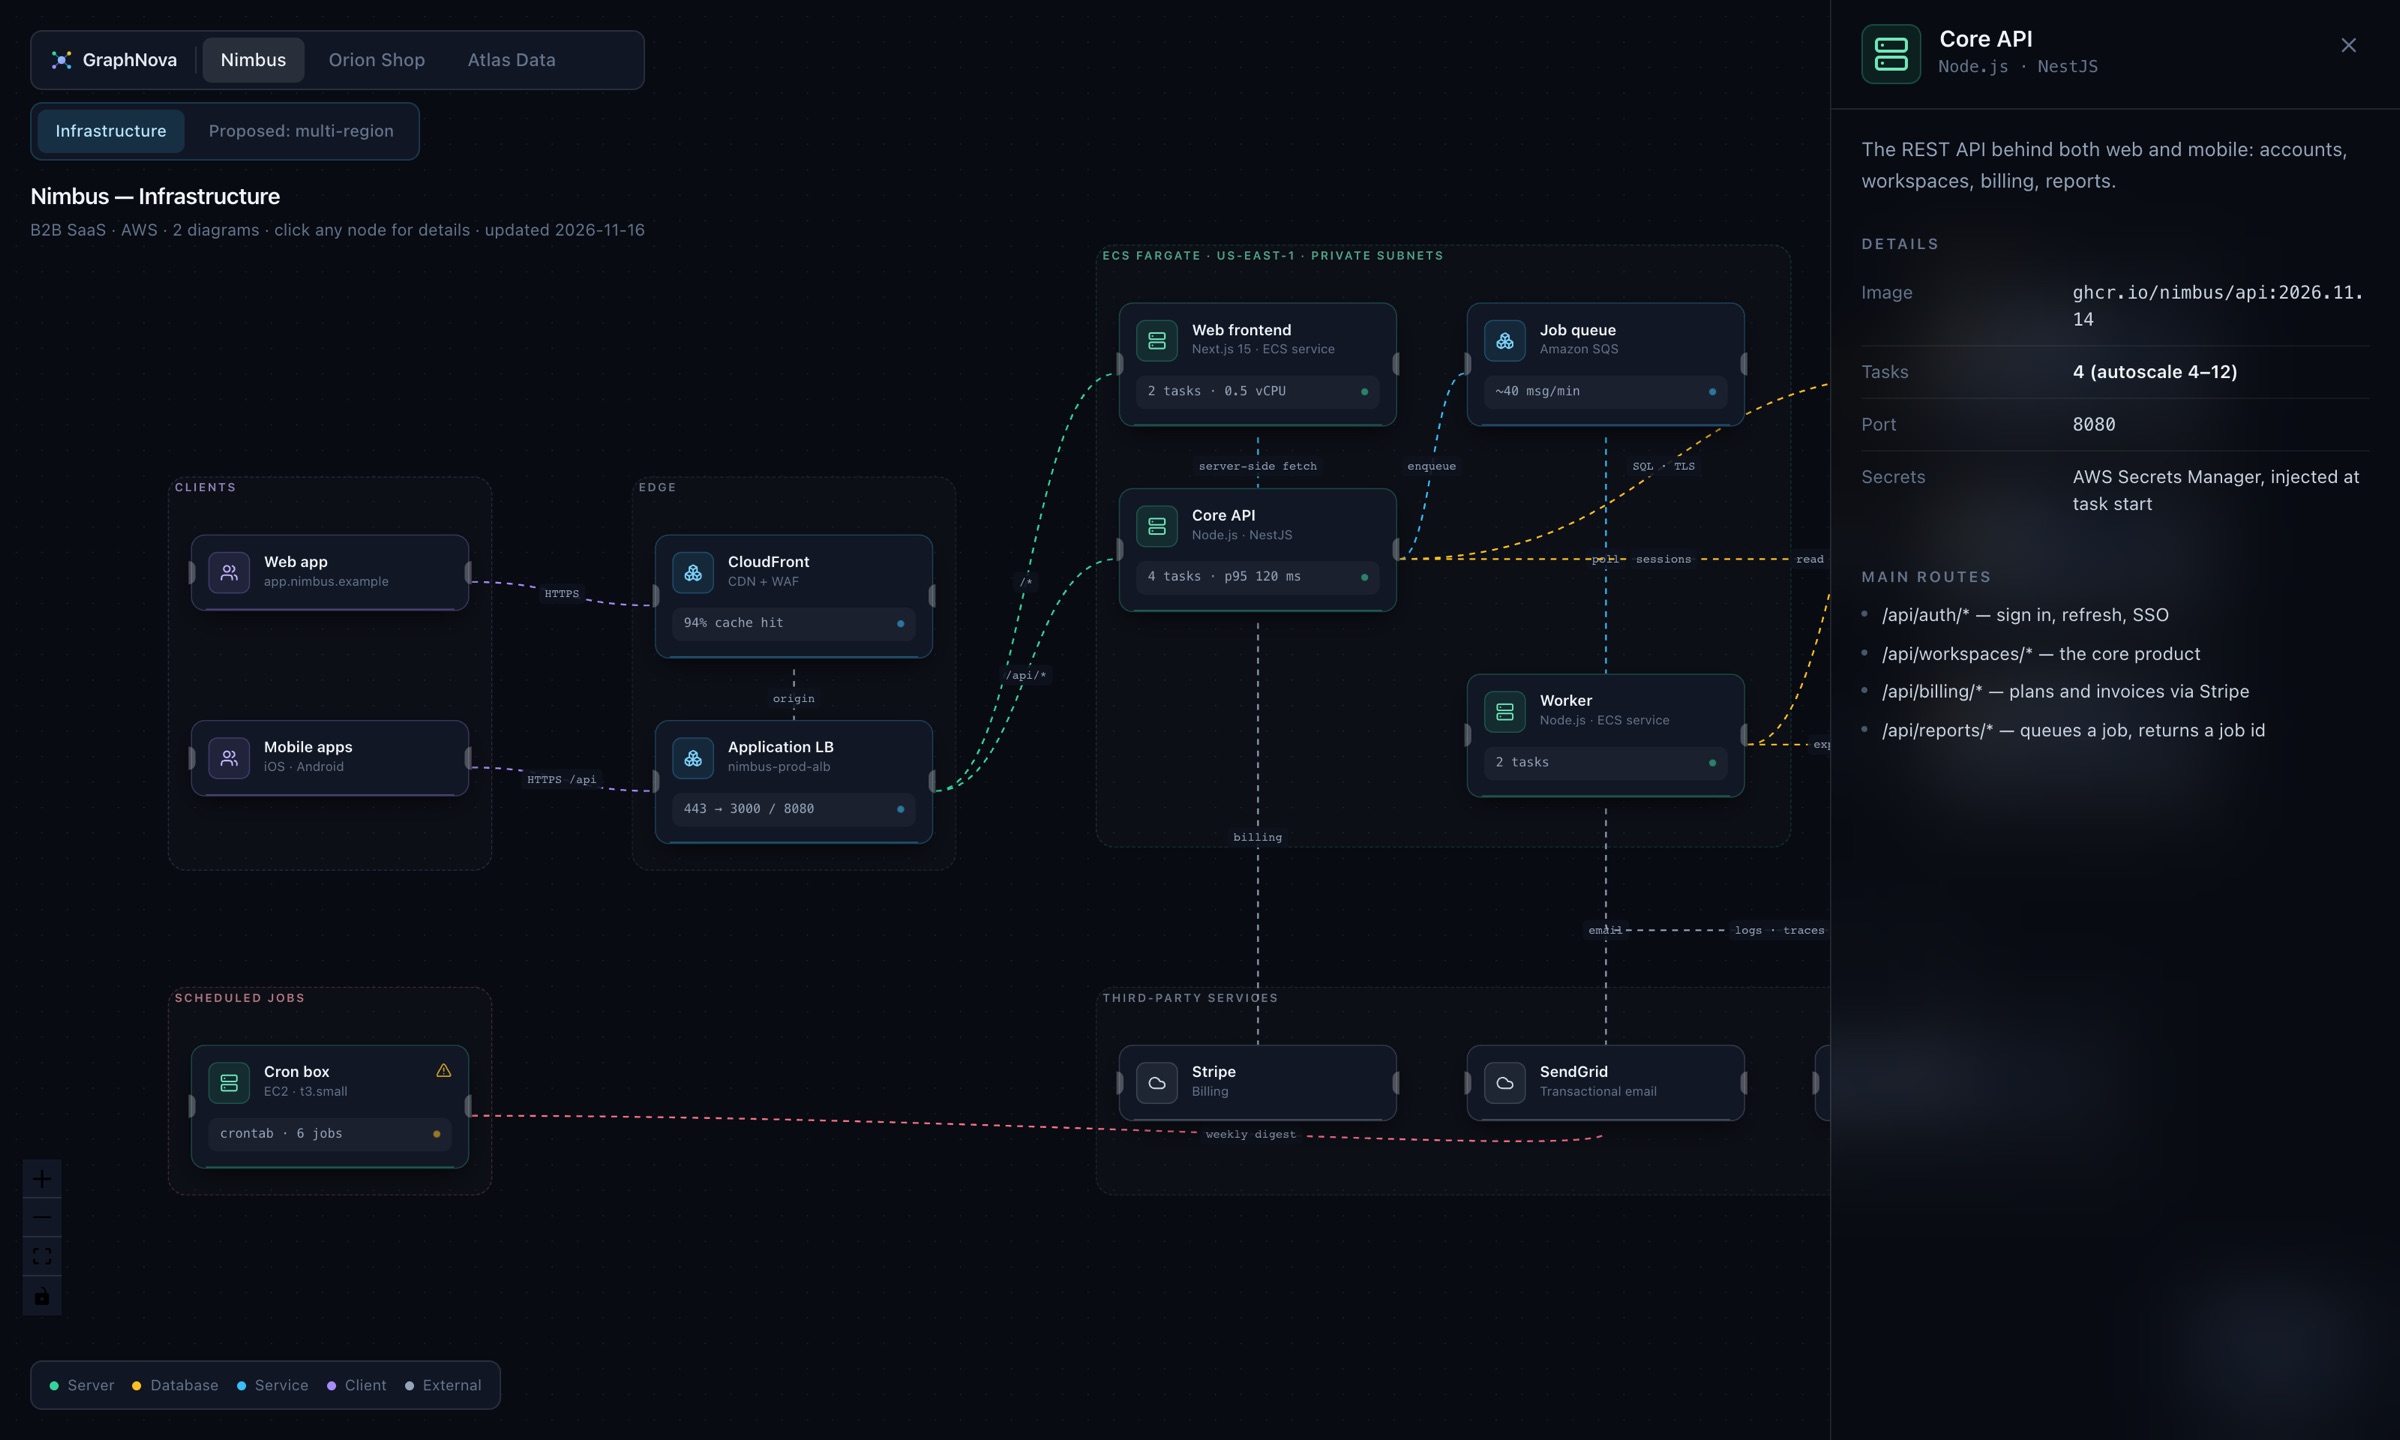
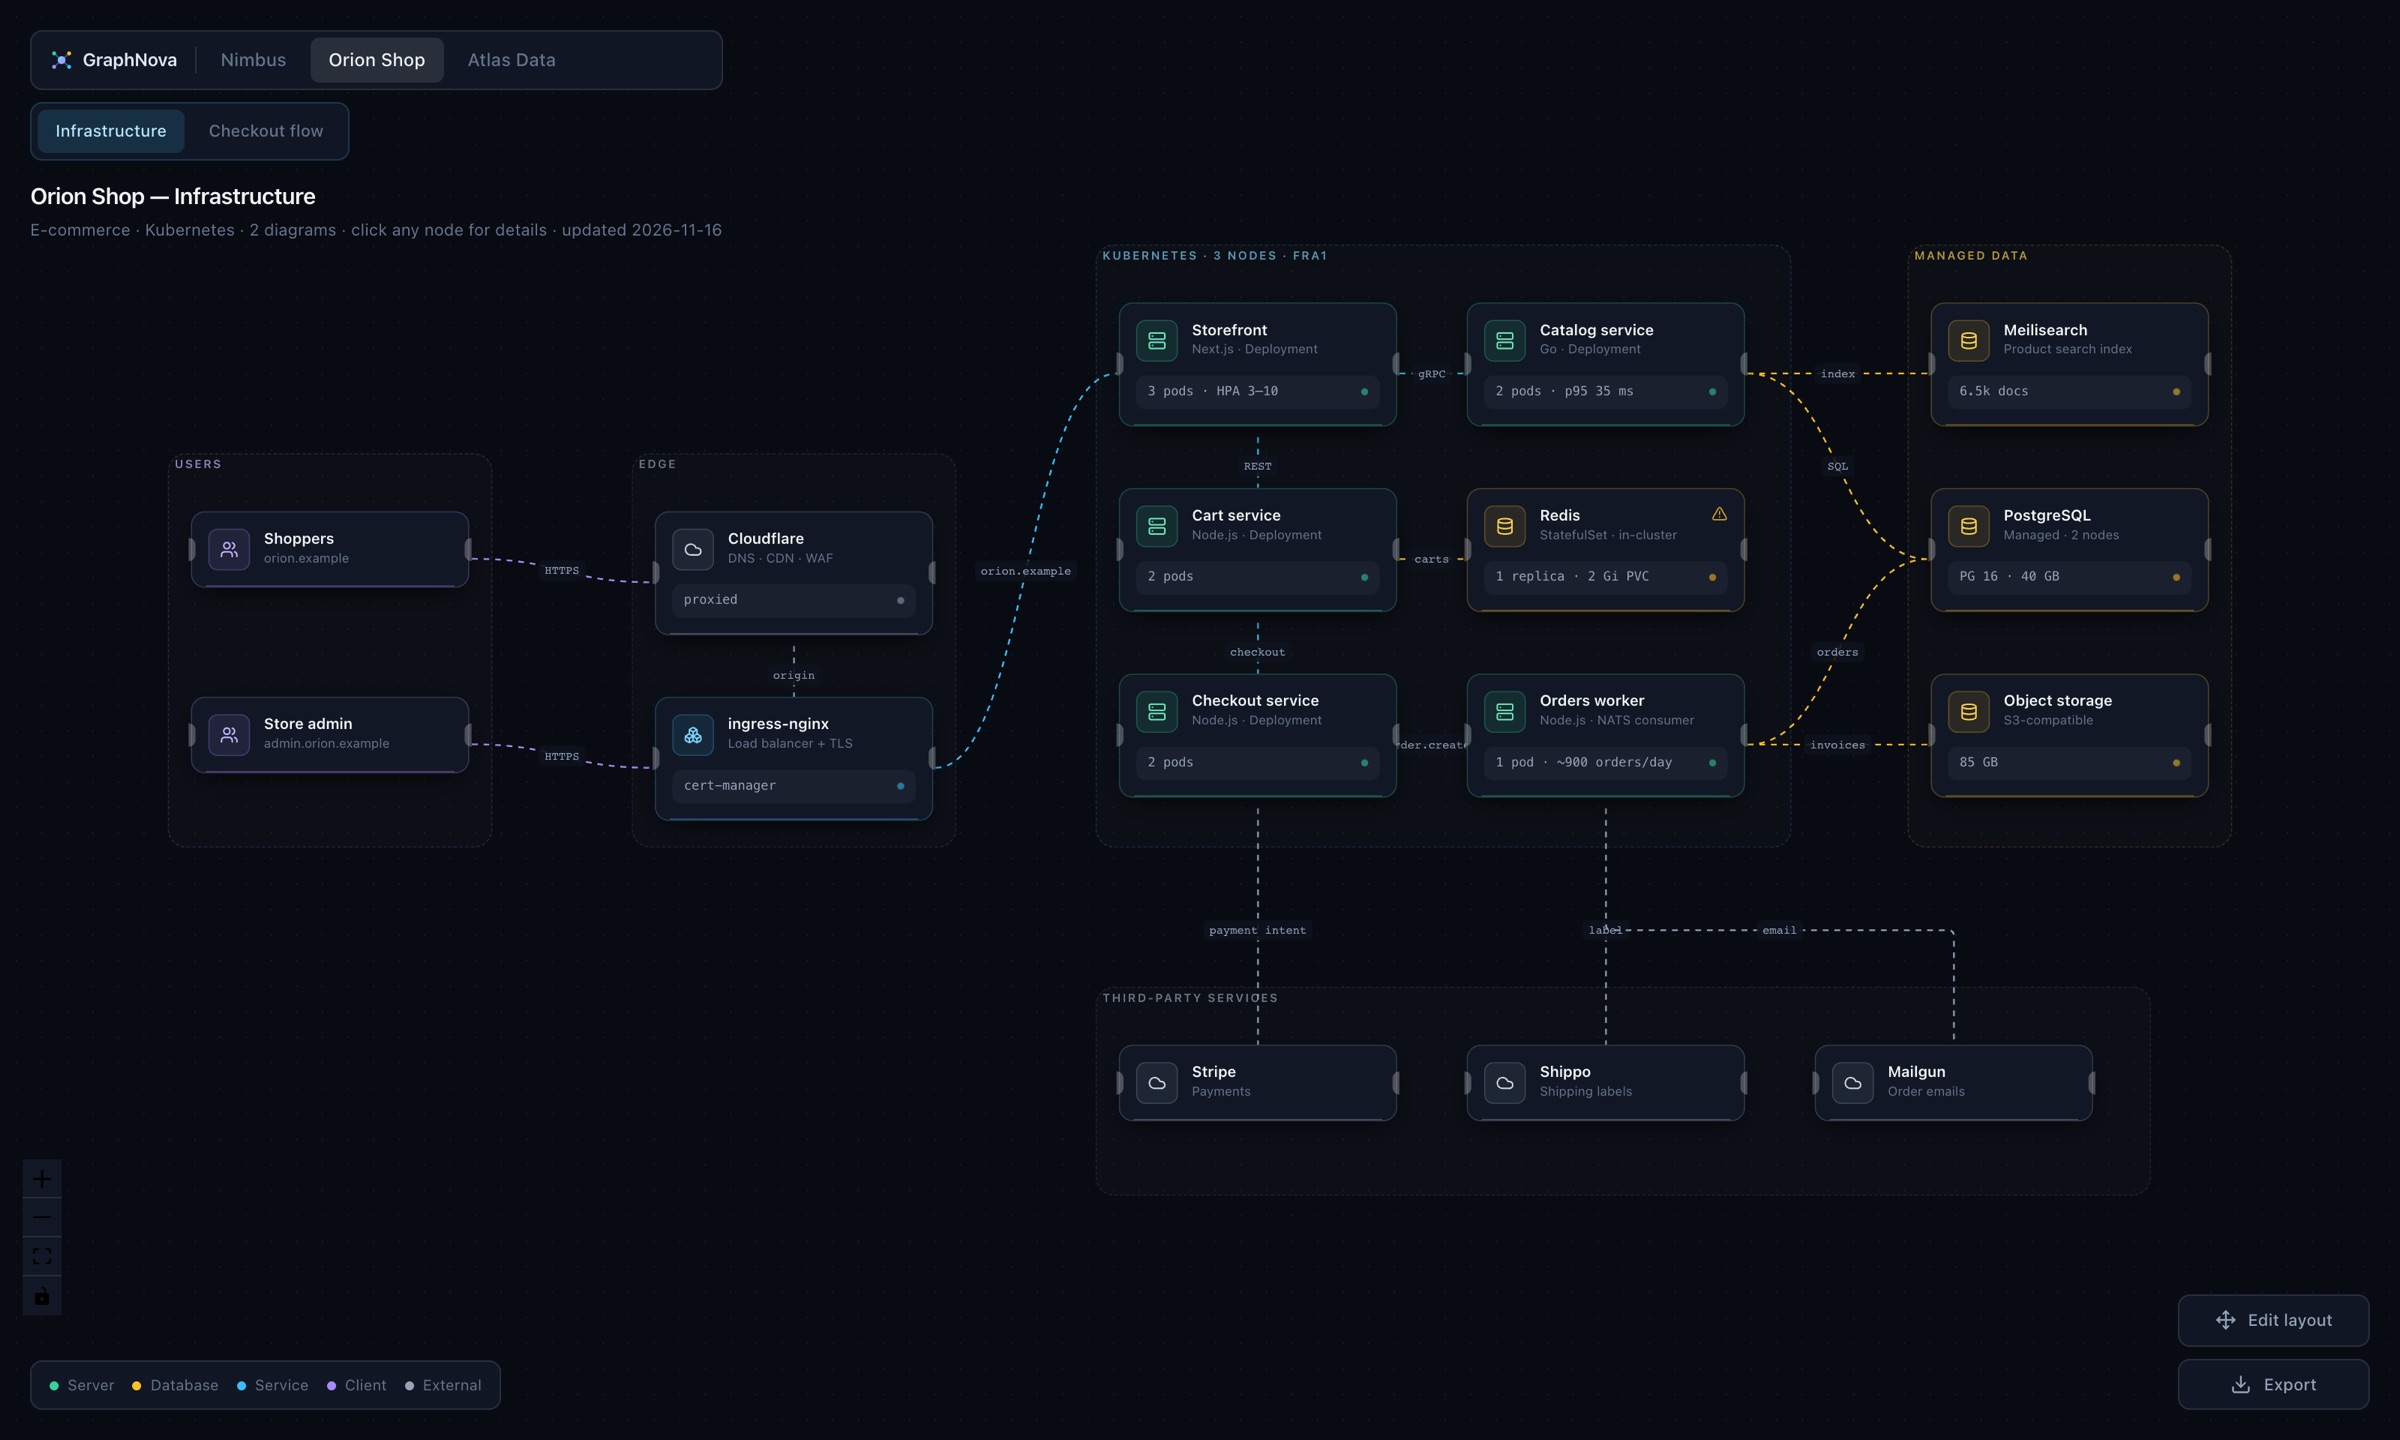
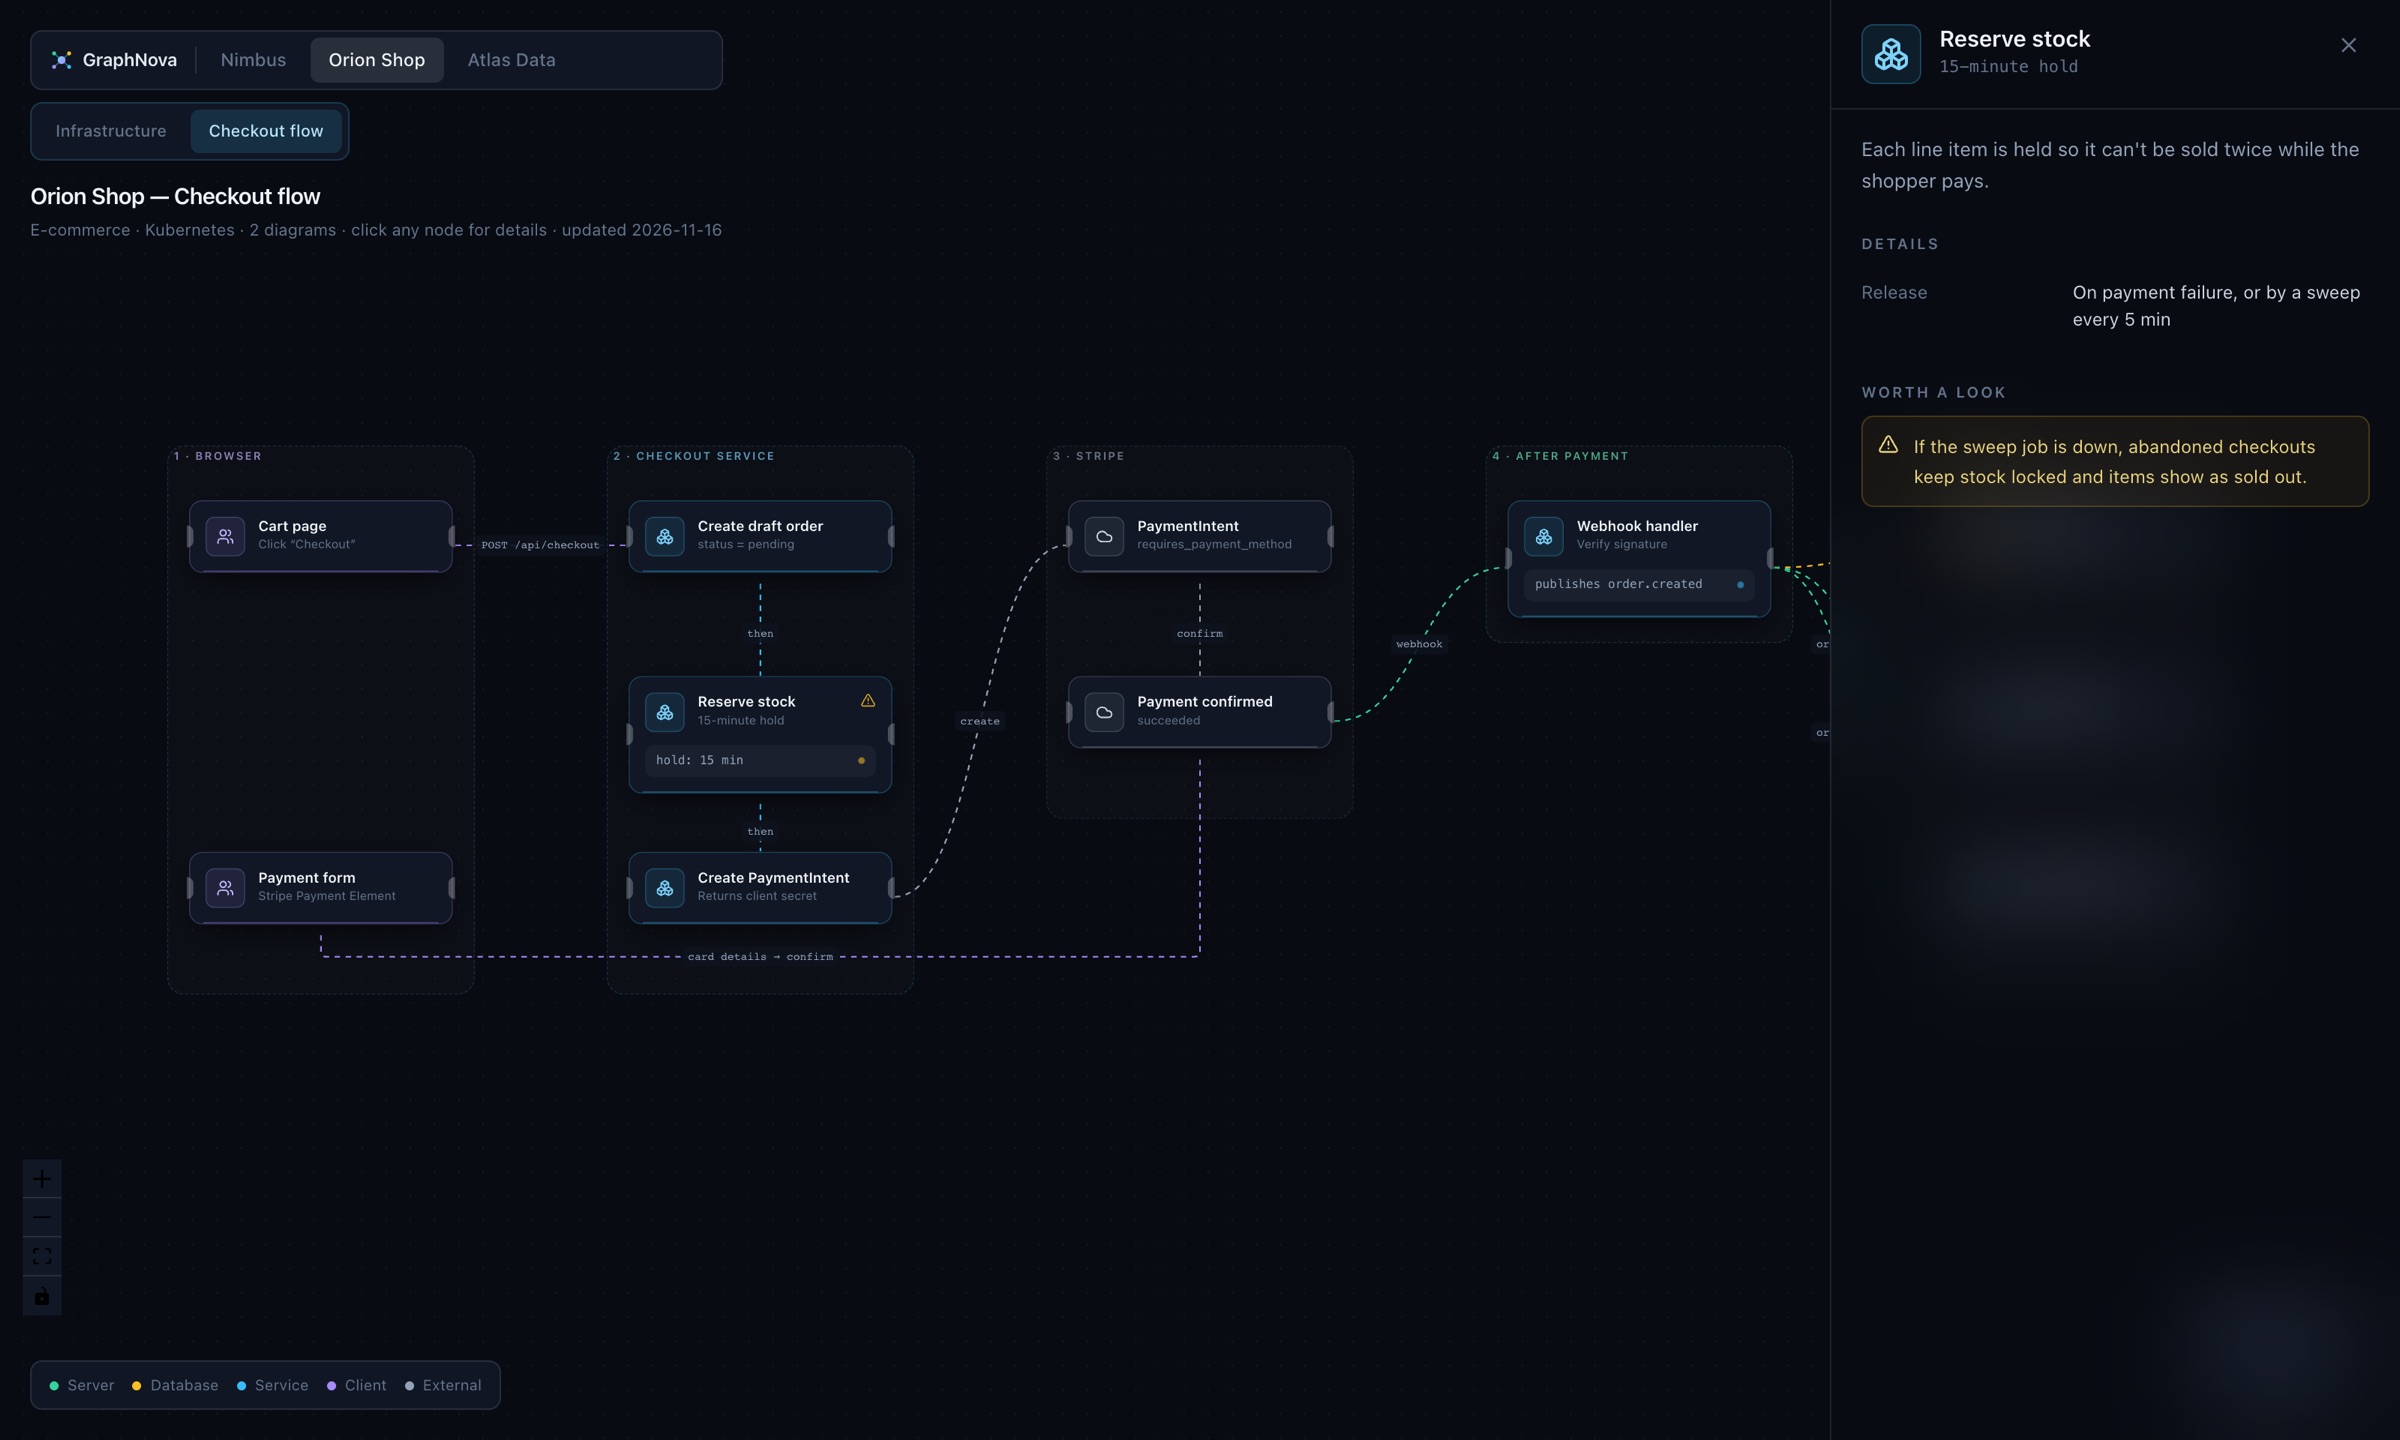
Every box opens a side panel with its summary, a details table, grouped lists and highlighted warnings.
Many diagrams per project
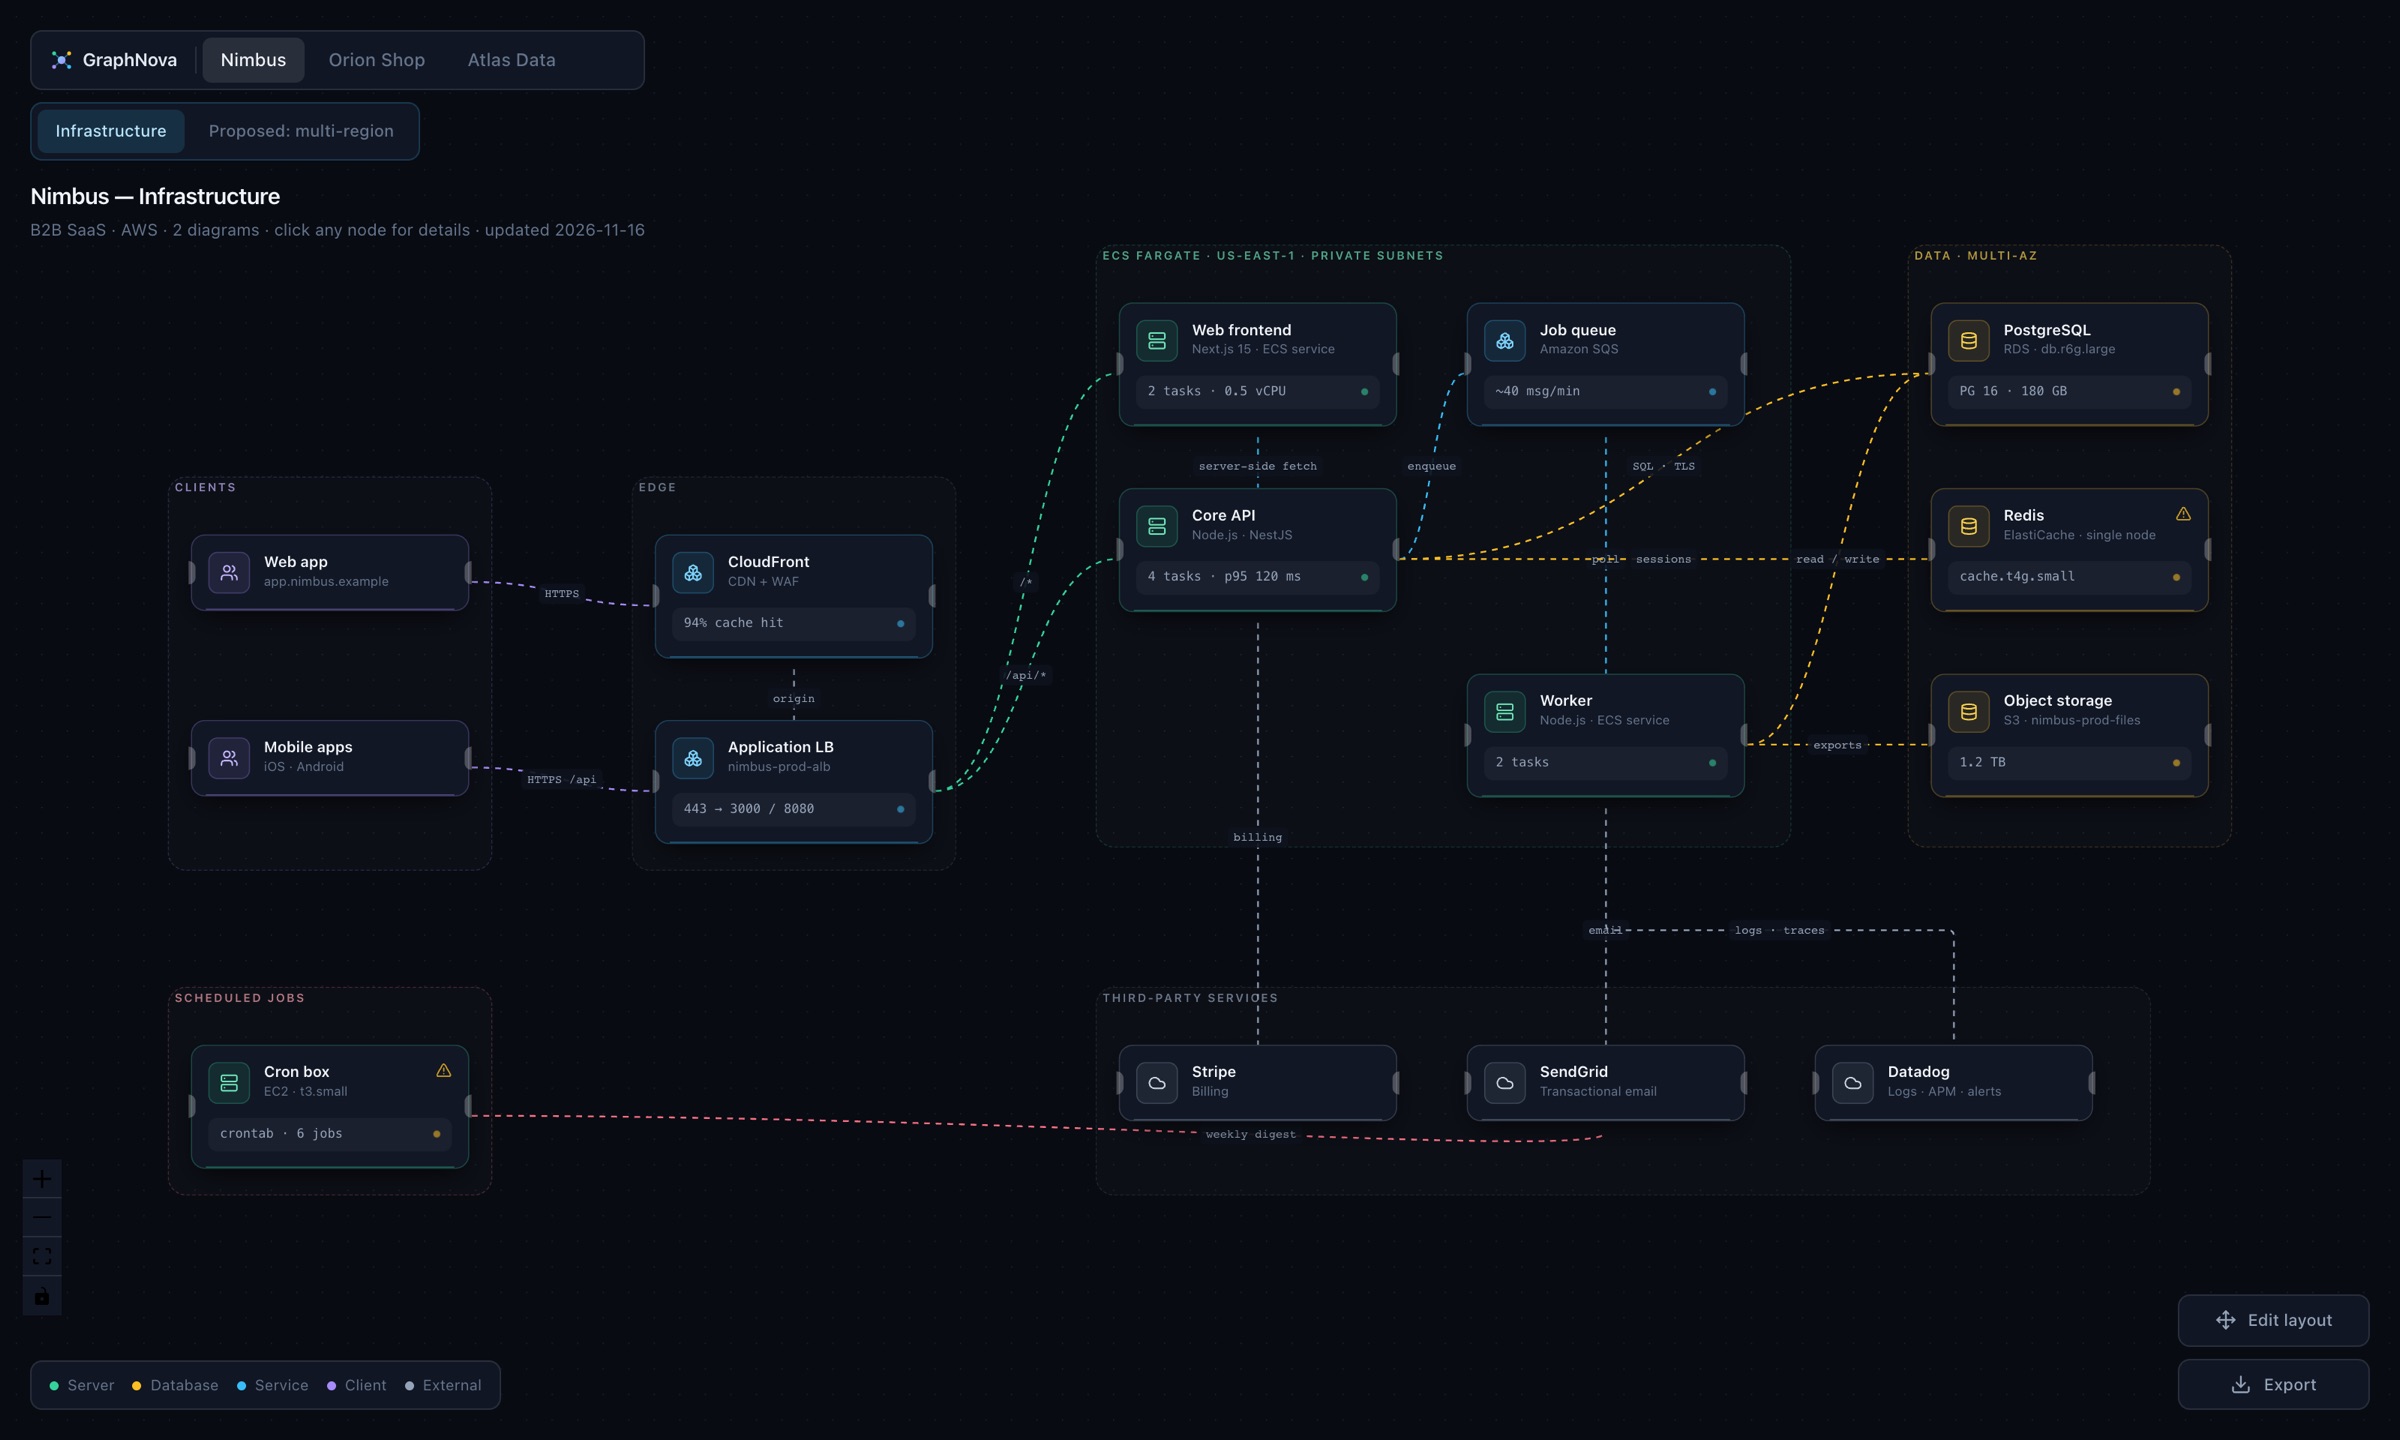
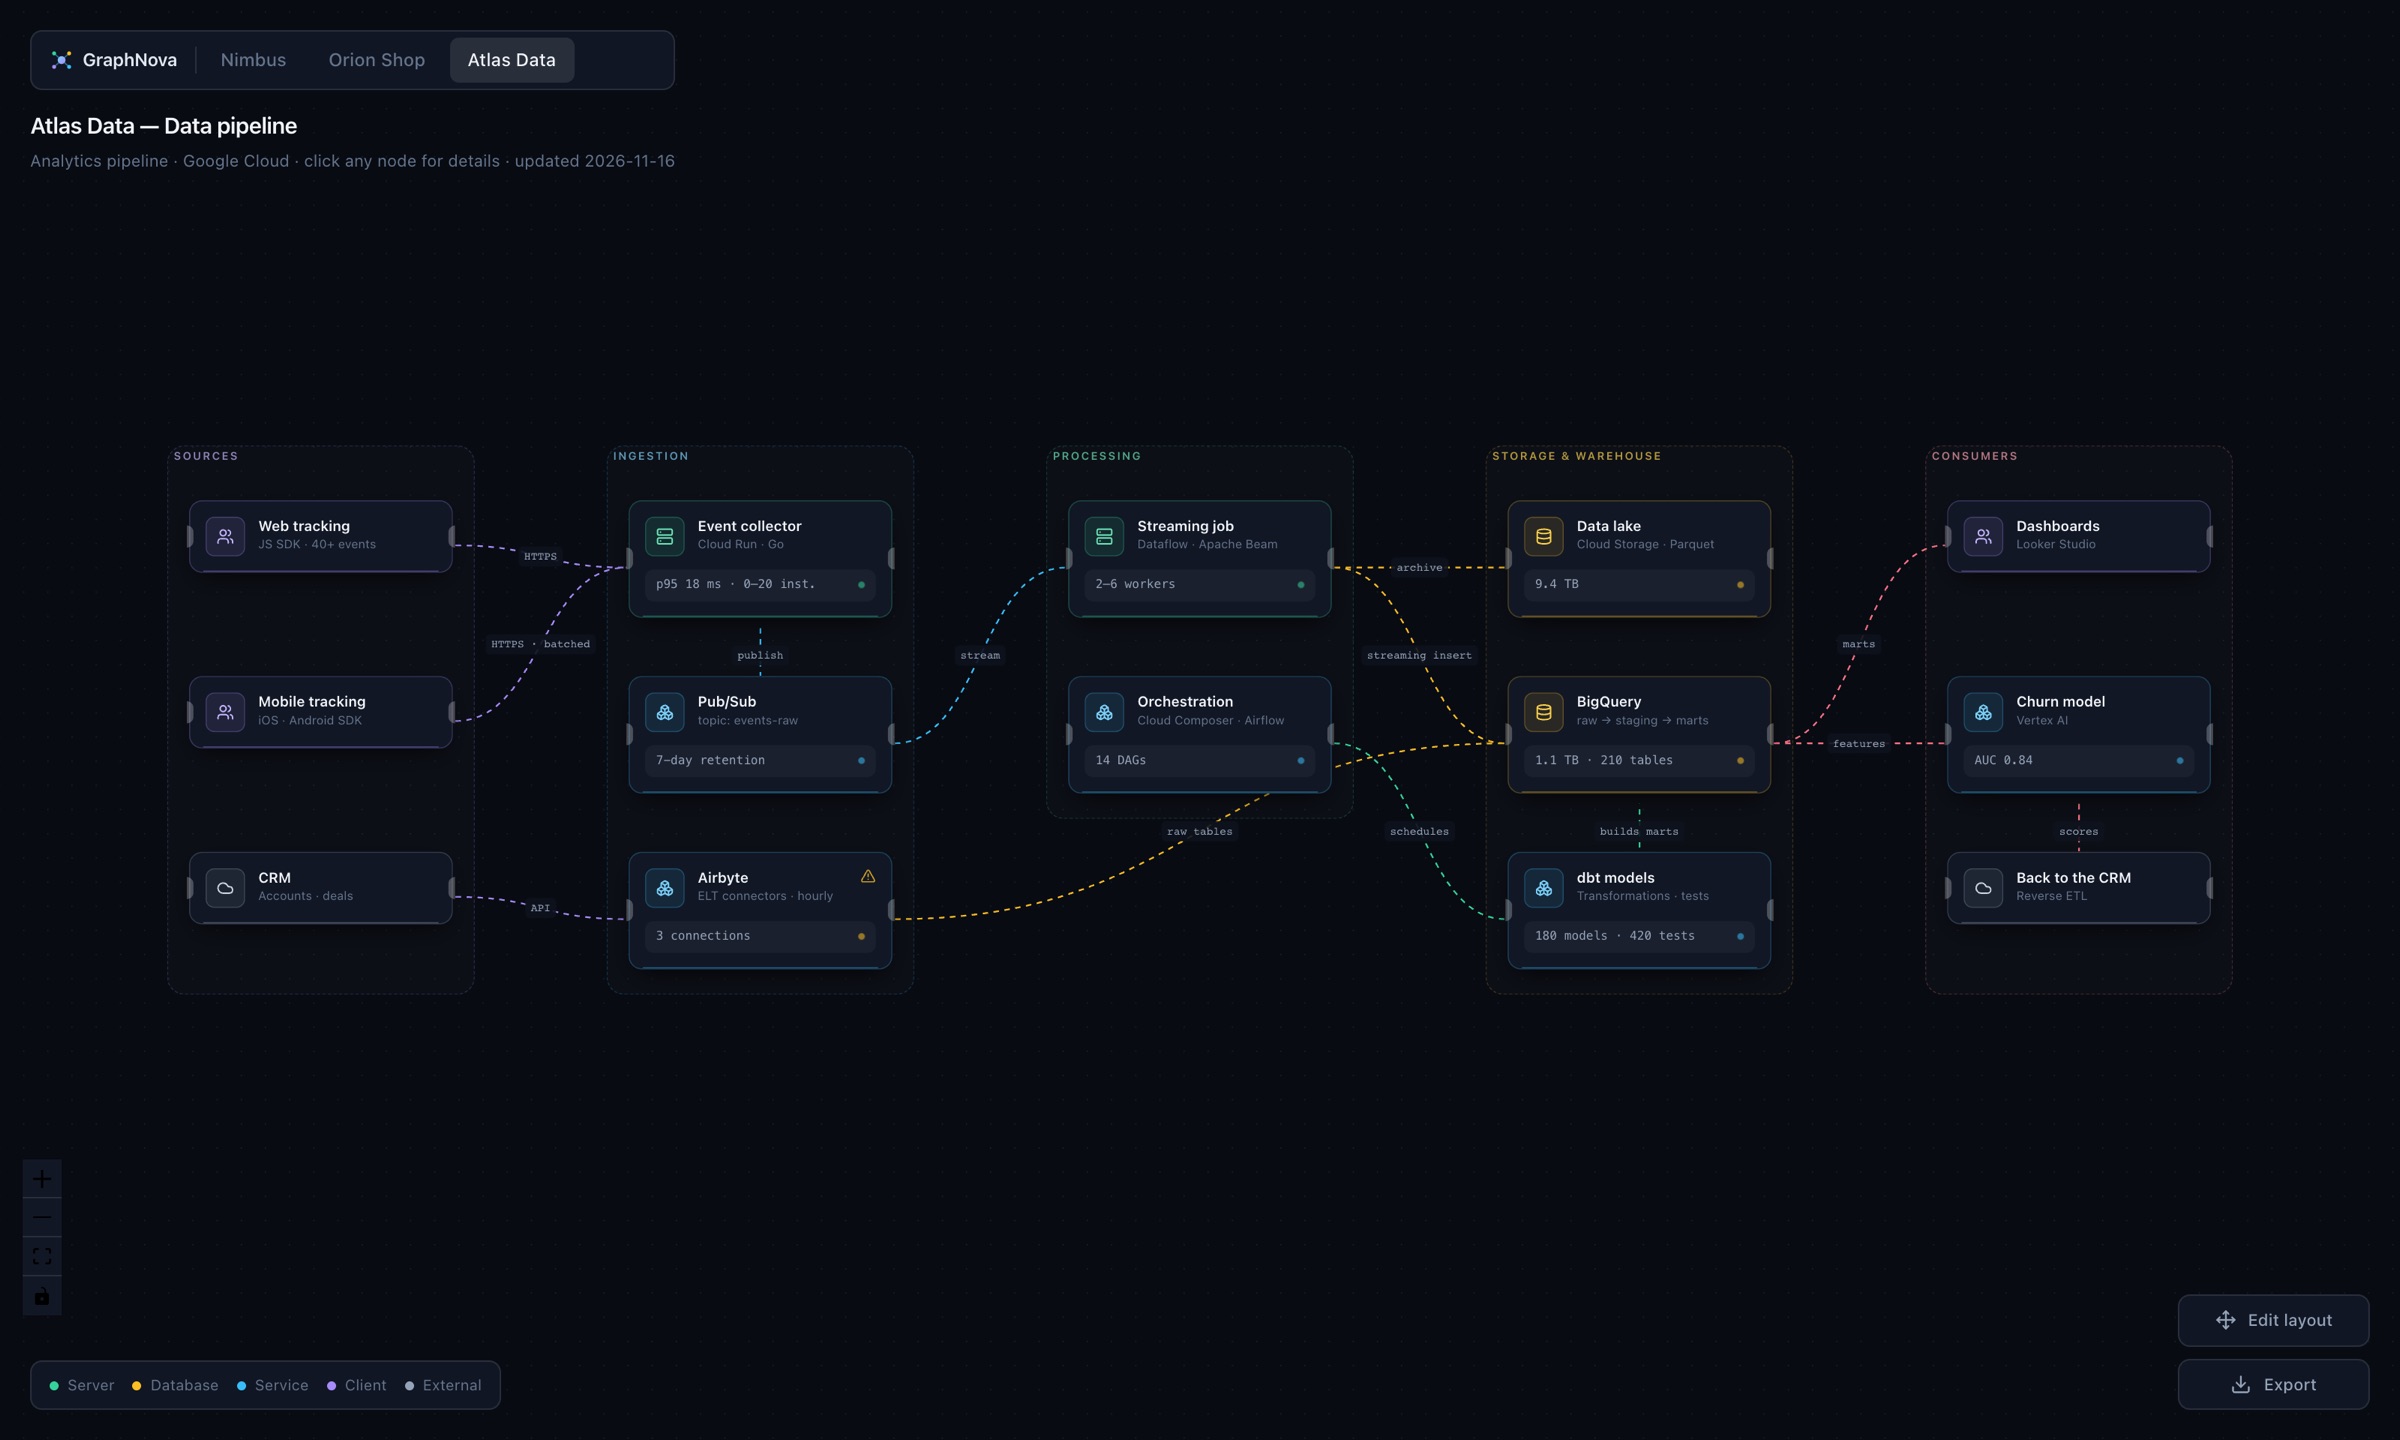
Infrastructure, request flows, auth or data pipelines side by side, switched from tabs above the canvas.
Change previews
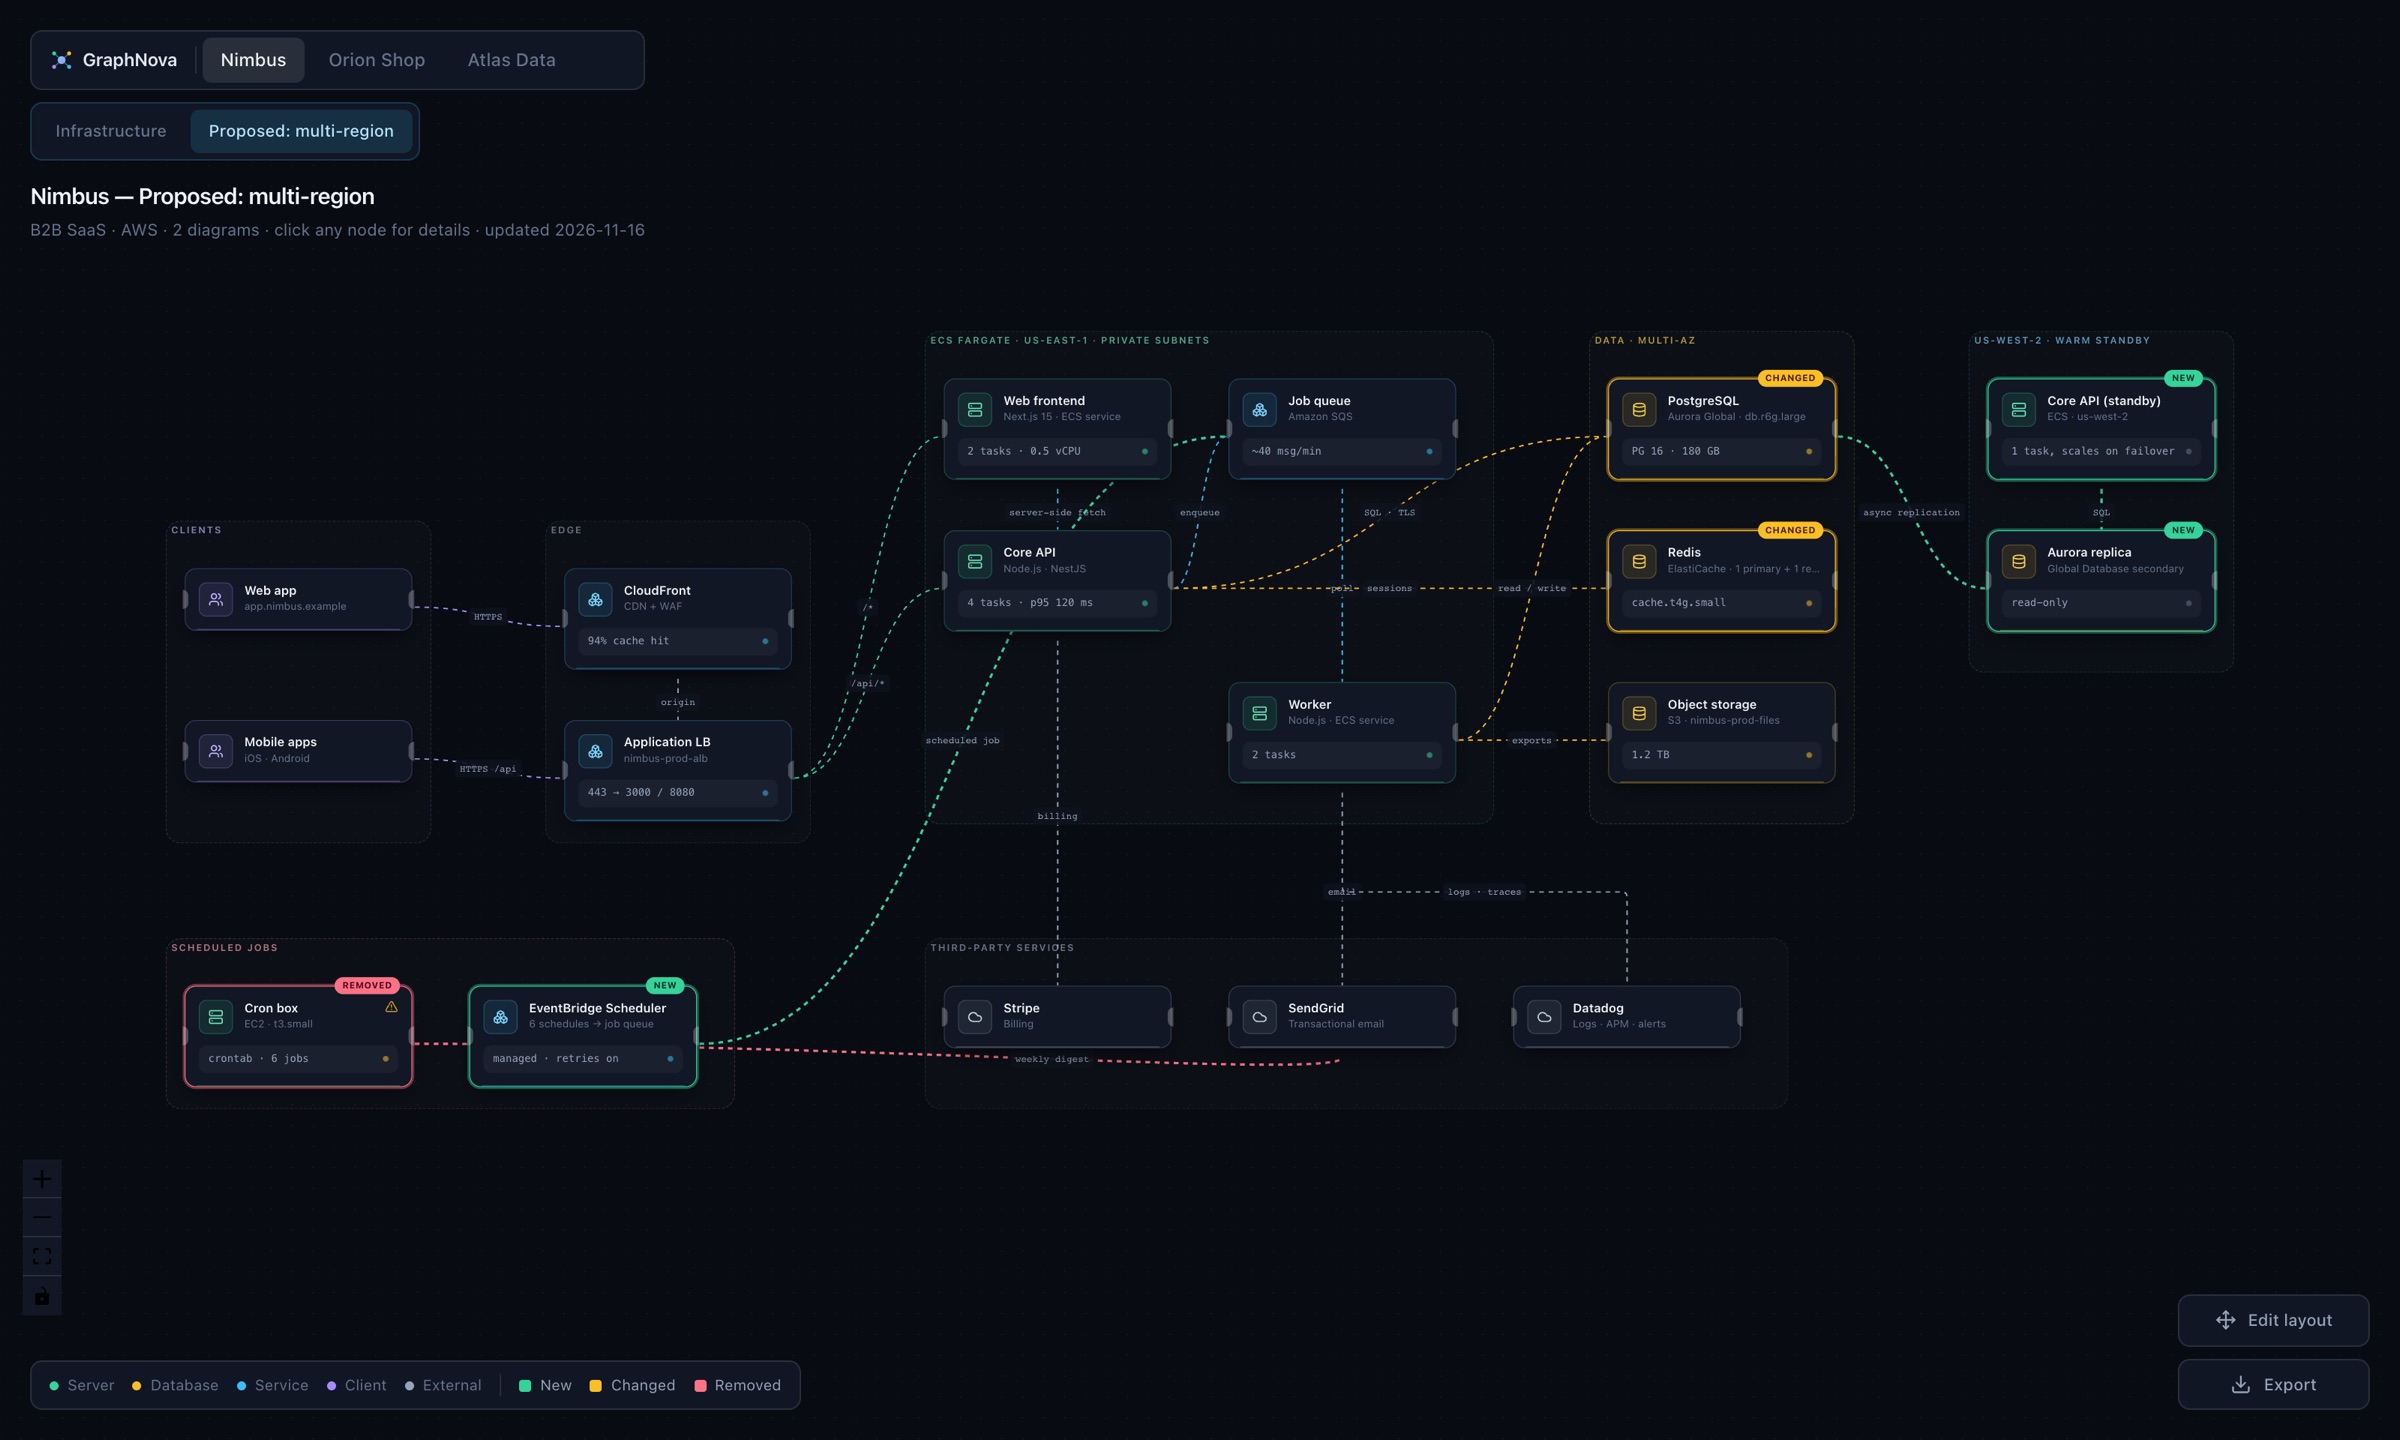
Draw a proposed change over the current system: new, changed and removed parts are marked, with notes on what moves.
Risks in context
Single points of failure, expiring software or open access are flagged on the box itself, not in a separate report.
Edit the layout
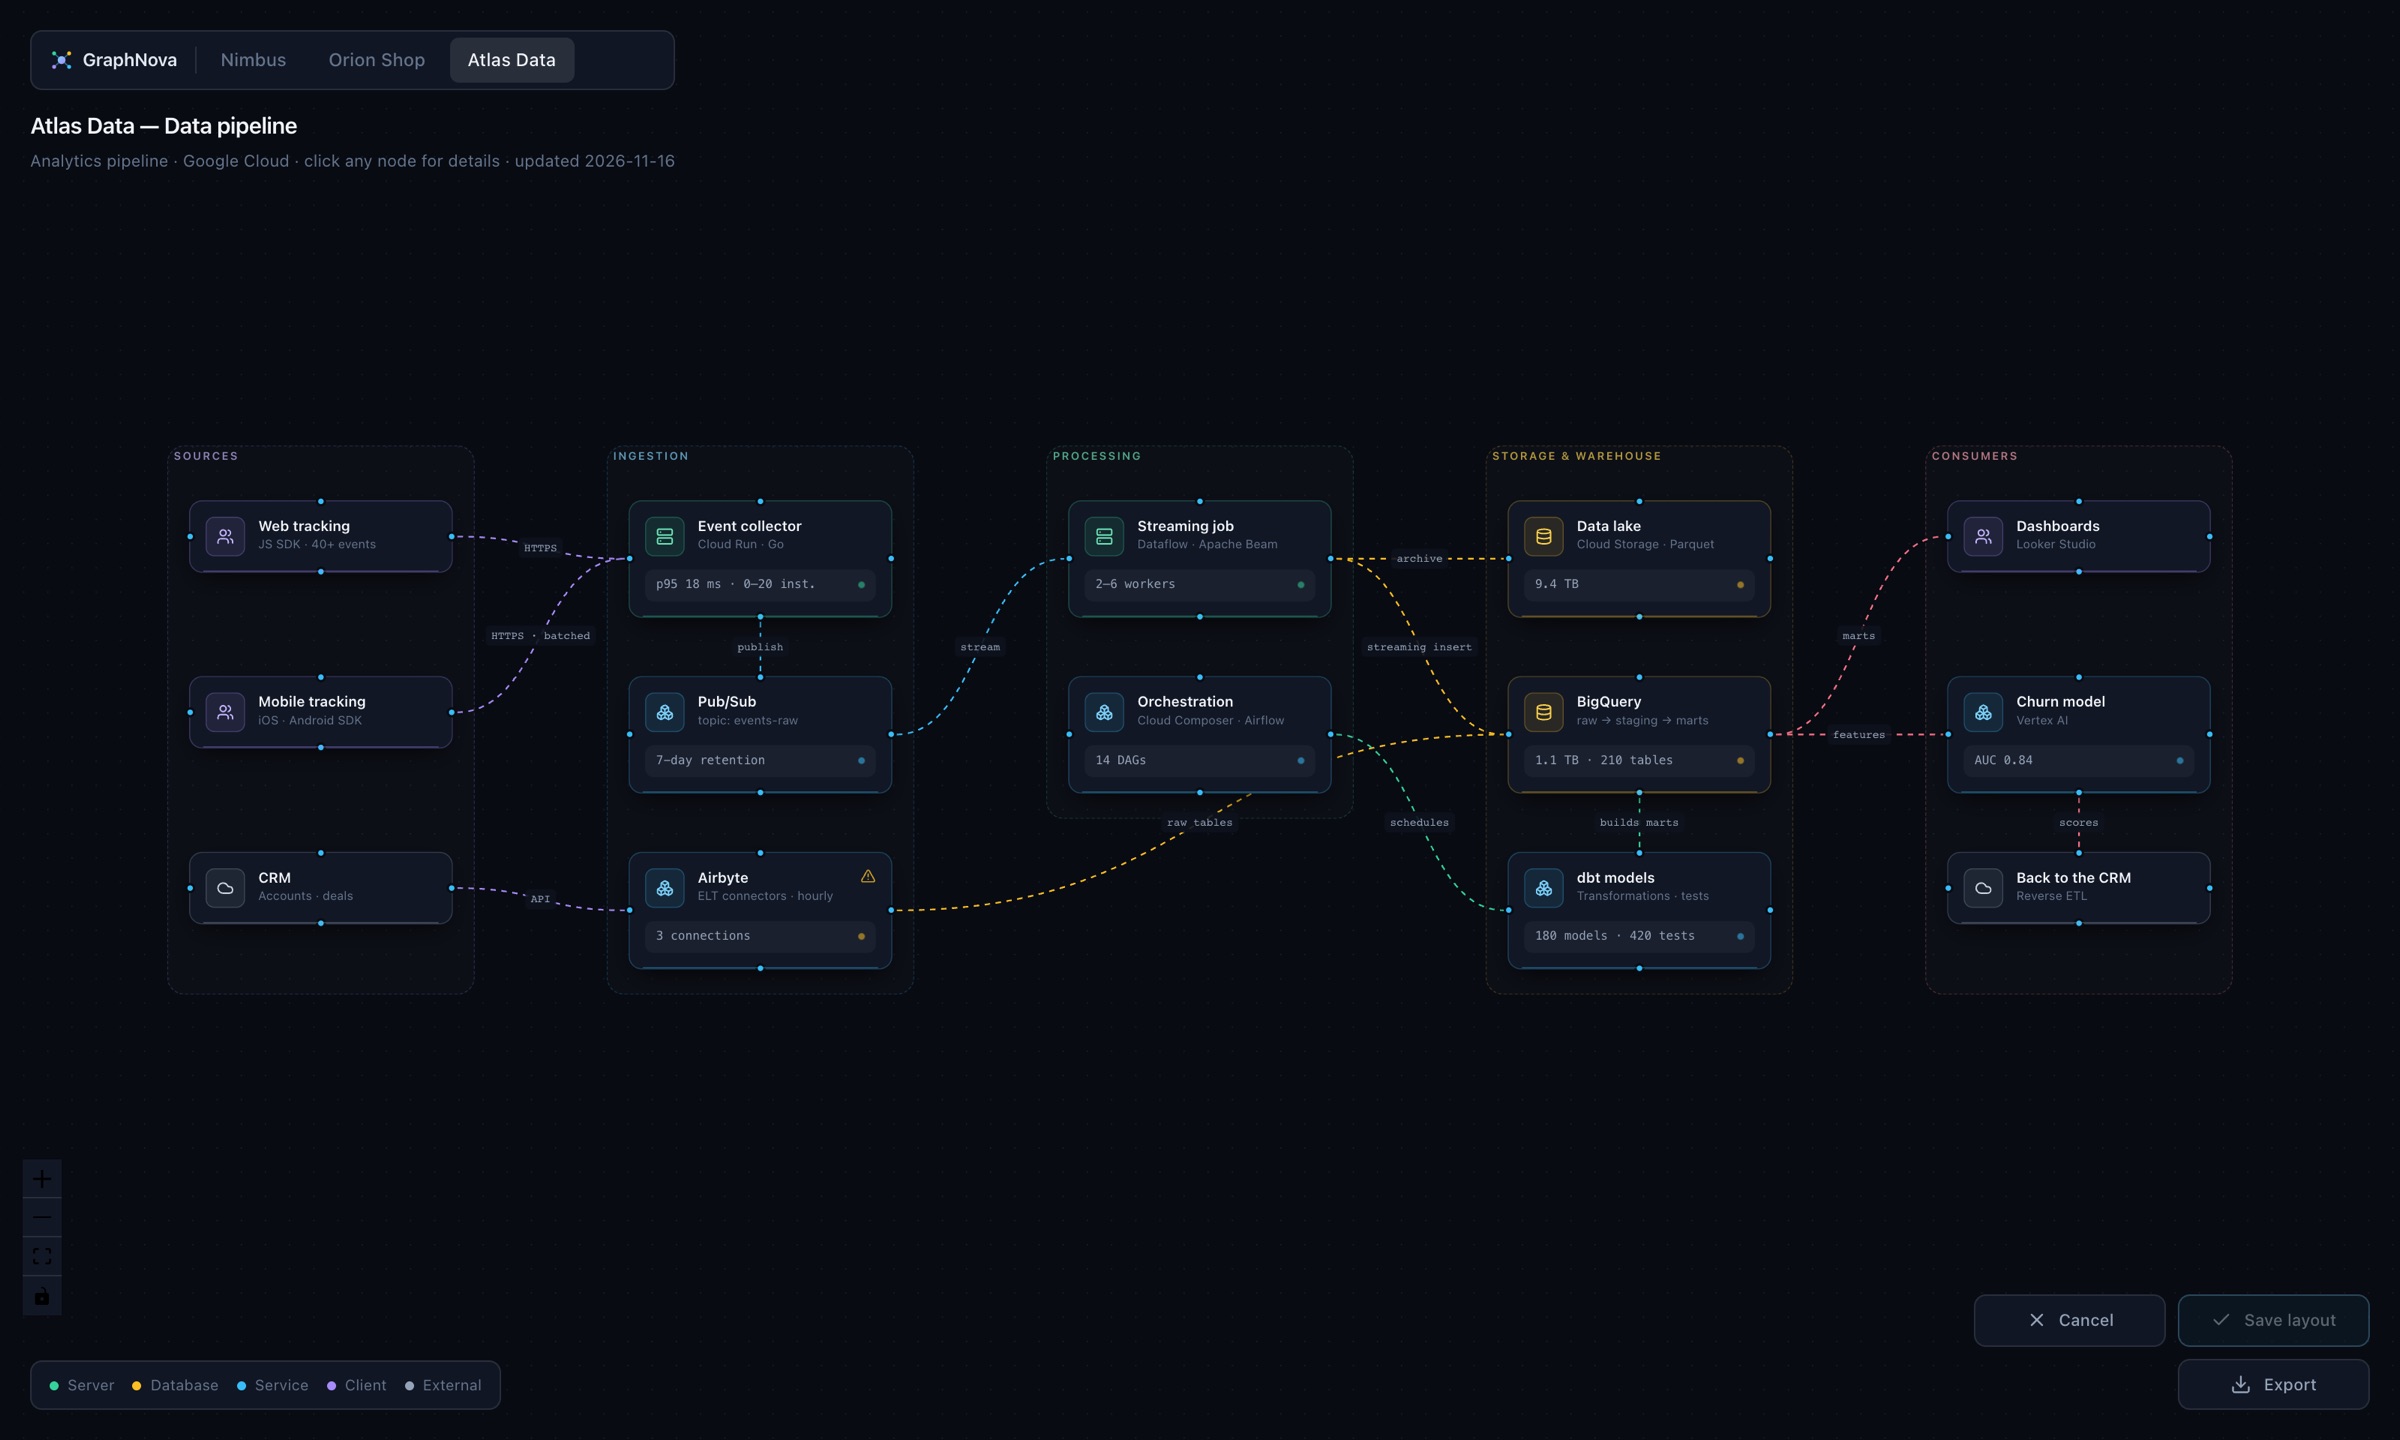
Drag boxes and groups, resize groups and re-route line ends; the arrangement is saved and can be reset at any time.
Export PNG & PDF
High-resolution exports of the whole diagram, ready for a slide, a ticket or an audit report.
Deep links
The URL tracks the project, diagram and selected box, so you can send a teammate straight to one component.
Embeddable
Run it standalone or inside another app: an iframe or webview can inject live diagrams, focus on given boxes and receive layout changes.
The app
Three example projects — a SaaS on AWS, a shop on Kubernetes and a data pipeline on Google Cloud. All names and data are fictional.
Web app
Your architecture stays private
GraphNova is a static app with your diagrams inside. There is no GraphNova cloud and nothing to sign up for.
No backend required
GraphNova compiles to static files. Serve it from your own nginx, an internal network or a private bucket.
Your data stays yours
Diagrams are files in your repository. Nothing is uploaded to a vendor and there is no account to create.
Reviewed like code
Because diagrams are data, every change goes through pull requests, history and code review.
Secrets stay out
Diagrams record which secrets a service needs and where they live — names, never values.
Host-controlled saving
Embedded, GraphNova only reports layout changes; the host app decides who may save them and where.
Private by default
Deploy it behind your SSO or VPN so architecture details are visible only to your team.
How it connects
Clients
App
GraphNova app React · React Flow
Canvas, tabs, detail panel, layout editing and export.
Static hosting nginx · Docker
A small container, or any static host or CDN.
Embed bridge (optional) postMessage · WebKit handler
Injects live diagrams and receives layout changes.
Data
Diagram files
One TypeScript file per project: groups, boxes, lines and details.
Saved layouts
In the browser on its own, or in the host app when embedded.
- Diagram files are bundled at build time, so the app needs no database or API to run.
- A host page can instead inject diagrams loaded live from its own storage, including pending proposals.
- Selecting a project, diagram or box updates the URL, so every view can be linked and bookmarked.
- Exports are rendered in the browser at high resolution and never leave the user's machine.
Built with
Frontend
Export
Build
DevOps
From one team to a whole platform
The same static app runs on a laptop, behind your VPN or inside another product.
Engineering teams
One container next to your other internal tools, with diagrams kept in the same repository.
- docker compose up
- Hot reload while editing diagrams
- Any static host in production
Audits & consulting
Document a client's real infrastructure, flag what is worth a look and deliver it as a map plus PDF.
- One project per client or system
- Warnings on the affected boxes
- PNG / PDF exports for the report
Platforms & internal portals
Embed GraphNova in your own product or developer portal and feed it live diagrams.
- iframe or native webview
- Live data and change previews
- Custom integrations by Singularity Box
Requirements
- Runtime
- Any modern browser — Chrome, Safari, Firefox, Edge
- Hosting
- Static files: nginx, a CDN, S3 or the bundled Docker image
- Server size
- Minimal — about 1 MB of assets, no database
- Development
- Node 20+ or Docker
- Embedding (optional)
- An iframe with ?embed=1, or a webview with a message handler
Built for teams that run real systems
DevOps & platform teams
One place that shows how production really fits together, kept current alongside the code.
Security & compliance
Map what runs where, mark the risks on the components themselves and export the evidence.
Consultancies & agencies
Hand clients a clear, explorable picture of their systems instead of a static diagram.
Onboarding new engineers
A guided tour of the architecture they can click through on day one.
Want GraphNova for your organization?
The source code lives in a private repository. Live demos and walkthroughs with your own architecture are available on request.